THE GLOBAL EDITION 01
English
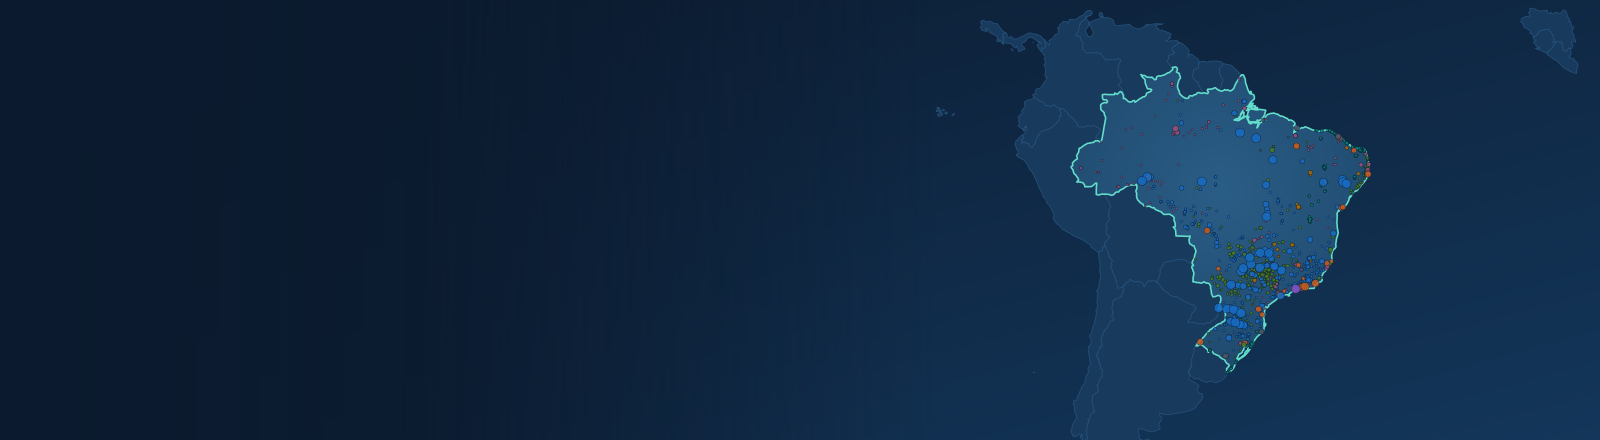
Map of 2,360 power-plant records in Brazil, coloured by fuel and sized by reported capacity where available
← Country directoryBRA / COUNTRY PROFILE

Power plants in Brazil

2,360 power-plant records · 147,589.271 MW reported capacity (2,360 of 2,360 records)

  • Hydro 30%
  • Oil 27%
  • Biomass 19%
Explore Brazil on the map

Brazil has 2,360 power plants in this atlas, with 147,589 MW of reported capacity. The largest listed plant is Tucuruí (8,535 MW, hydro; current status unverified). By number of records the most common technologies are hydro, oil and biomass. Grid operators listed here include ONS. Electricity is regulated by ANEEL. Renewables supplied 87.3% of its electricity in 2024.

Data compiled from official inventories and open sources; see data sources and coverage.

Brazil at a glance

Power-plant records
2,360
Reported capacity
147,589.271 MW2,360 of 2,360 records report MW
Renewable electricity (2024)
87.3%
Most records
Hydro, Oil
Grid operator
ONS
Capital
Brasília

Largest plants with reported capacity

  1. 1Tucuruí8,535 MW
  2. 2Itaipu (Parte Brasileira)7,000 MW
  3. 3Jirau3,750 MW
  4. 4Santo Antônio3,568 MW
  5. 5Ilha Solteira3,444 MW
  6. 6Belo Monte3,327.455 MW
  7. 7Xingó3,162 MW
  8. 8Paulo Afonso IV2,462.4 MW
Full list of power plants in Brazil ↓

Records by technology

Counts records, not generation share · coverage & dates

Reported capacity is the rated size of the listed installations, not electricity being produced now. Source dates and coverage differ, so newer facilities may be absent and historical records may remain.

THE ELECTRICITY SYSTEM IN CONTEXT

Brazil: hydropower alongside expanding wind and distributed solar

Reporting scope: Brazilian Energy Balance 2025; base year 2024.

Electricity and total energy have different mixes

EPE's 2025 balance reports 88.2% renewables in Brazil's total electric power supply in 2024, compared with 50% in total energy supply. Transport fuels and other energy uses belong to the latter measure. Neither percentage is the share of renewable station records on this map.

Source: EPE: Brazilian Energy Balance 2025 summary, 2024 observations.

Small generators matter outside a plant atlas

EPE reports wind and solar together supplying 23.7% of domestic electricity generation in 2024 and includes distributed micro and minigeneration in its statistics. A global station inventory can miss these installations. Use national generation data to compare the mix, and the atlas to examine individual reported locations and ownership.

Source: EPE: centralised and distributed electricity generation.

By Power Stations Worldwide · Context sources checked · Review scope. This date does not update the underlying plant inventory or electricity series.

Grid operators and electricity market in Brazil

Wholesale marketCompetitive generation, regulated retail

Hydropower supplies over half of electricity, with wind and solar growing fast. Power is sold through regulated auctions and a free market settled by CCEE; retail choice is opening to smaller consumers.

  1. GenerationGenerators bid into a market
  2. TransmissionSystem operator dispatches
  3. DistributionRegulated distributors
  4. CustomersRegulated tariffs

Who regulates

Who controls the grid

ONS dispatches the national interconnected system; transmission lines are owned by many concession holders; about 50 distributors serve consumers.

Markets & power exchanges

Regional grid

Not part of a larger synchronous grid or regional power pool.

What does “Wholesale market” mean?

Power plants compete to sell electricity in a wholesale market or pool, dispatched by a system operator. Most consumers still buy from a regulated distribution company at approved tariffs.

References reviewed 2026-09-29. Logos are each organisation’s own site icon, shown to identify it. Selected organisations, not an exhaustive list of licence holders.

Browse the worldwide operator directory
ELECTRICITY IN 2024

Electricity production in Brazil

Electricity generated745.7 TWh
Renewable share87.3%
Low-carbon share89.5%
Carbon intensity106.1 gCO₂e/kWh

Electricity mix 2024

Annual generation by source · terawatt-hours (TWh)

Hydro413.2 TWh
Wind108.5 TWh
Solar71.3 TWh
Bioenergy58.2 TWh
Other renewablesNo data
Nuclear15.8 TWh
Coal16.2 TWh
Gas48.8 TWh
Other fossil13.7 TWh

Missing categories are labelled “No data”. Rounding can cause small differences from the reported total.

Source: Ember (2026), processed by Our World in Data · CC BY 4.0 · Snapshot 24 April 2026. Method & download details.

Brazil electricity generation, fuel mix and annual data

Regional comparisons: Americas electricity production · South America electricity production

Explore trends & country comparisons

Geography and data notes

Brazil is in South America. Its coastal or island geography provides a different setting for electricity infrastructure from inland systems. This profile connects country reference information with the historical station inventory and reported electricity generation.

Capital
Brasília
Languages
Portuguese
Region
South America

Geographic reference: Countries geographic database (ODbL). Boundaries and names are for orientation; language listings are introductory, not exhaustive. Banner map: Natural Earth boundaries (public domain) with this atlas’s station records.

The source inventory contains 2,360 records for Brazil. Select a fuel in the map to explore where its stations are located, then open a record to inspect reported capacity and provenance.

Inventory coverage

2,360 source records. 0 reported operational in their source snapshot; this is not live status.

2,360 lack an owner/operator; 385 lack a commissioning year.

Coverage, dates & exclusions
THE GENERATION INVENTORY

List of power plants in Brazil

Open country map

Browse 2,360 source records, ordered by reported capacity. Ownership and operating status describe the source snapshot; they may have changed. Missing information is shown explicitly.
Browse all 2,360 records in linked pages

Jump to an inventory page48 pages

Pages follow reported capacity, with up to 50 records per page. Choose a page below; search and generation filters remain in the country inventory.

Published selection: 12 records. JavaScript loads the full searchable inventory.

MW measures rated capacity, not electricity generated. Records may describe units, installations, projects or whole complexes. Review inventory coverage and licenses. Download this country’s records.