Reported capacity is the rated size of the listed installations, not electricity being produced now. Source dates and coverage differ, so newer facilities may be absent and historical records may remain.
How electricity works in the United Kingdom
Liberalised marketCompetitive generation and retail
Gas and wind are the main sources, with nuclear, solar and imports. Generators and suppliers trade bilaterally and on exchanges; Ofgem's price cap limits standard household tariffs. Northern Ireland is part of the all-island Single Electricity Market.
NESO, a public corporation, runs the grid in Great Britain; National Grid, SP Energy Networks and SSEN own the transmission lines, and 14 regional distribution areas deliver power. SONI and NIE Networks serve Northern Ireland.
Great Britain runs its own synchronous grid, linked to Ireland, France, Belgium, the Netherlands, Norway and Denmark by undersea direct-current cables.
Ireland and Northern Ireland share one synchronous grid and a Single Electricity Market, connected to Great Britain by undersea cables.
What does “Liberalised market” mean?
Generators sell into a wholesale market, an independent operator runs the transmission grid, and households can choose their electricity supplier. Networks stay regulated monopolies because building parallel power lines makes no sense.
Great Britain and Northern Ireland have separate system operators and wholesale market arrangements. Network owners and local distribution companies are additional organisations.
References reviewed 2026-09-29. Logos are each organisation’s own site icon, shown to identify it. Selected organisations, not an exhaustive list of licence holders.
United Kingdom is in Northern Europe. Its coastal or island geography provides a different setting for electricity infrastructure from inland systems. This profile connects country reference information with the historical station inventory and reported electricity generation.
Capital
London
Languages
English
Region
Northern Europe
Geographic reference: Countries geographic database (ODbL). Boundaries and names are for orientation; language listings are introductory, not exhaustive. Banner map: Natural Earth boundaries (public domain) with this atlas’s station records.
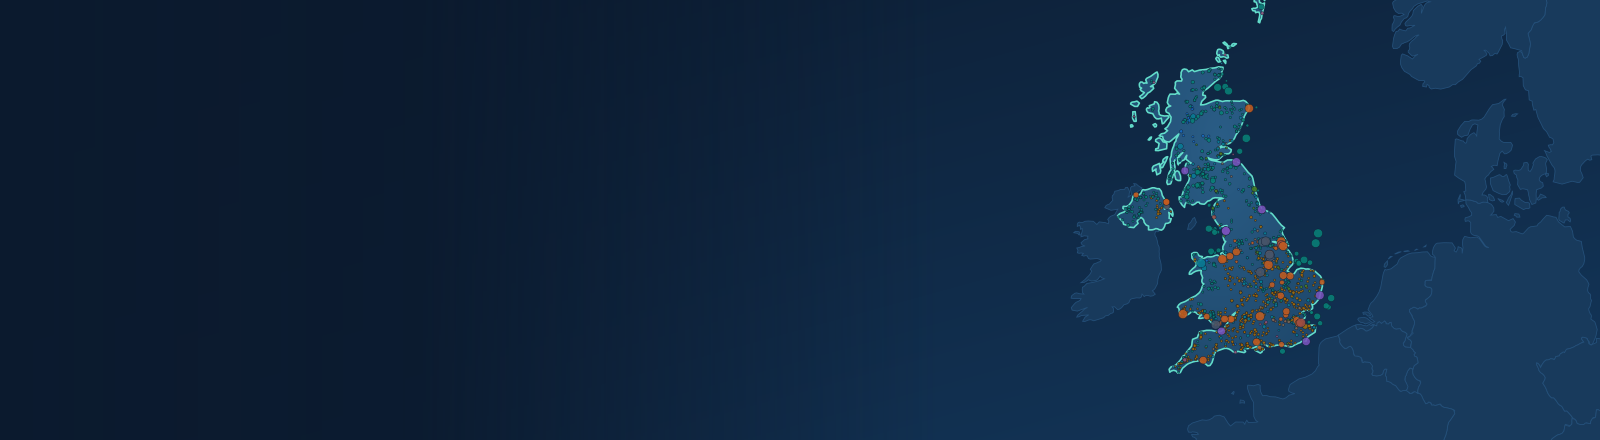
The source inventory contains 3,216 records for United Kingdom. Select a fuel in the map to explore where its stations are located, then open a record to inspect reported capacity and provenance.
Inventory coverage
3,216 source records. 3,127 reported operational in their source snapshot; this is not live status.
Browse 3,216 source records, ordered by reported capacity. Ownership and operating status describe the source snapshot; they may have changed. Missing information is shown explicitly.
Published selection: 12 records. JavaScript loads the full searchable inventory.