Reported capacity is the rated size of the listed installations, not electricity being produced now. Source dates and coverage differ, so newer facilities may be absent and historical records may remain.
How electricity works in the United States
Mixed, by regionRules differ between states or provinces
FERC regulates wholesale markets and interstate transmission; each state's public utility commission sets retail rates. About a dozen states let households choose a supplier; in the Southeast and West, integrated utilities still run most of the system.
About 3,000 utilities: investor-owned, public power and cooperatives. Seven regional grid operators (ISOs/RTOs) such as PJM, MISO, ERCOT and CAISO run wholesale markets covering about two thirds of demand.
Part of the North American grid, split into the Eastern, Western, Texas (ERCOT) and Québec interconnections, with reliability standards set by NERC.
What does “Mixed, by region” mean?
Different parts of the country organise electricity differently: some regions run competitive wholesale markets, while others are served by vertically integrated utilities under state or provincial regulation.
The United States has multiple regional systems, balancing authorities and utility territories. These seven ISO/RTO links do not cover every US utility or grid. ERCOT has a different jurisdictional framework from the other six.
References reviewed 2026-09-29. Logos are each organisation’s own site icon, shown to identify it. Selected organisations, not an exhaustive list of licence holders.
United States is in North America. Its coastal or island geography provides a different setting for electricity infrastructure from inland systems. This profile connects country reference information with the historical station inventory and reported electricity generation.
Capital
Washington D.C.
Languages
English
Region
North America
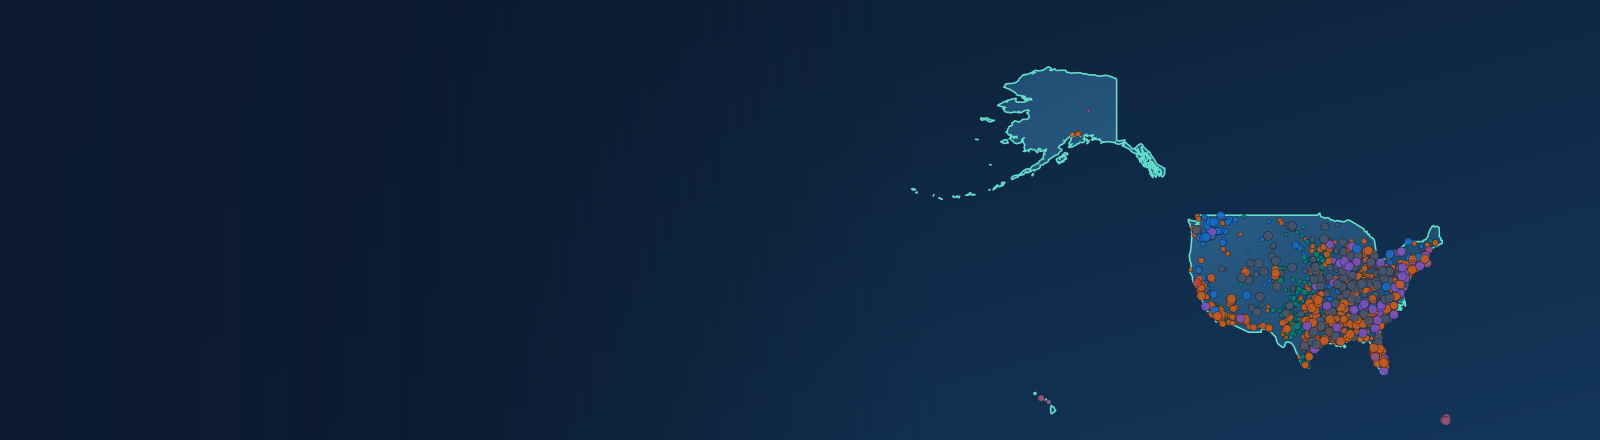
Geographic reference: Countries geographic database (ODbL). Boundaries and names are for orientation; language listings are introductory, not exhaustive. Banner map: Natural Earth boundaries (public domain) with this atlas’s station records.
The source inventory contains 9,833 records for United States. Select a fuel in the map to explore where its stations are located, then open a record to inspect reported capacity and provenance.
Inventory coverage
9,833 source records. 0 reported operational in their source snapshot; this is not live status.
Browse 9,833 source records, ordered by reported capacity. Ownership and operating status describe the source snapshot; they may have changed. Missing information is shown explicitly.
Published selection: 12 records. JavaScript loads the full searchable inventory.